| Hi everyone,
I am also looking for input and views.
Best Regards Lars
== Caveats == C1) Only 60% percent of the reviews on the mailing list could be matched to commits. This can be improved going forward, but we felt that the dataset is big enough for statical analysis and didn't want to spend too much time to get the matching perfect at this stage. See "Coverage analysis" for more details
C2) In many cases, you will only want to look at median (green) rather mean (blue) trends in sections 1-5. In particular where the numbers are small. Also note that there is significant monthly variation in some graphs and thus graphs may be skewed by freeze periods, holidays, ... in those cases it is really necessary to look at the integral areas underneath the graphs and/or trend lines.
C3) Some of the time related diagrams in section 6 show data in different ways (e.g. [67] and [68]). For example, - [67] maps the starting point of a completed review to a year - [68] maps the end points of a completed review to a year The former is less prone to be skewed by freeze periods, holidays, dev summits, ... == Summary == S1) We had a very high influx of complex patches, clogging up the review pipeline. However the situation seems to be have become better in the first half of 2015.
S2) We have had an increase of 10% per year of submitted patches since 2011
S3) The median number of review comments per patch has increased from around 3 (from 2009 to 2013) to 5 after 2013. This appears to be a reflection of higher demands on quality, but there are other explanations also. But indications are, that the root cause is that higher quality is expected today compared to the past.
S4) Contributors have become better at re-work: in 2011 the average time reviewers waited for patches to be re-worked while a series was reviewed was around 30 days, now it is around 15 days. For an exact definition see 1, Time to re-work a patch
S5) The community is faster at turning around review cycles: up to 2012 a single review cycle (e.g. from v1 to v2, v2 to v3, ...) took approx. 13 days, and was around approx. 7 since
S6) We do seem to have increased the number of people who actively review individual patches (the median was 2 and now is 3 per patch), but the overall number of reviewers has stayed the same. ]
S7) However, the variations on all the above figures have become generally higher: in other words we do have more "outliers" - aka individual patch series - which go into the opposite direction
S8) Historically we have handled an average of 513 patch series a year. The *bad news* is that we have about a years worth of patches (481) which had review activity in the last 12 months. And a bit more than a year's backlog (600) which is stalled and didn't receive attention for 12 months. But we do not yet have data how this has evolved historically, so we don't know yet whether the last 2 years were different to what we have seen in the past.
It is worth noting that the same set of people are doing more reviews, more effectively. First a big thank you to our reviewers. However, this is an issue in the long run, which needs addressing.
== Explanation of Graphs (where not obvious) ==
=== Histograms and Log Scale diagrams in sections 1-5 ===
The time period covered is usually over the entire existence of the project, unless stated otherwise.
The histograms are pretty obvious: we know that the scales are a bit crude and will improve this.
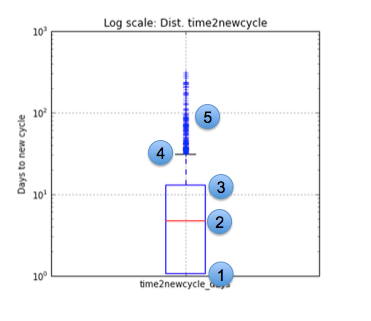
The log scale diagrams are more interesting (See LogScale.png for a legend). 1: 25% - in this example 25% of new review cycles are started within a day 2: 50% - in this example 50% of new review cycles are started within approx. 3.5 days 3: 75% - in this example 75% of new review cycles are started within approx. 10.5 days 4: Threshold for statistical significance - everything above the line is *not* statistically significant. In this case everything above 12 days is *not* statistically significant. 5: Shows a "+" for each datapoint that is not statistically significant
== Cycle Time [27] to [29] == This is not quite obvious from the definition in 1. For the cycle time, we basically ignore the mapping to a patch or patch series and just look at the cycle times between review iterations *regardless* of which series it belongs to.
For example [29] then tells us that the median cycle of any code review has been fairly static around 5 days from 2012.
== Backlog Analysis == This section shows us the total of patch series reviews that could be modelled (60%) over the project's life-time
Complete: 5641 Active (aka activity in the last 7 days) : 78 Ongoing (aka activity in the last 12 months): 403 Stalled (no activity for 12 months): 600 This is an area where time based diagrams would help, such that we understand whether things have become much worse than in the past. On the face of it, the figures are *worrying*: in particular if you consider we historically have handled an average of 513 patch series a year, we have the equivalent of - a year's worth of backlog which is active - a bit more than a year's backlog which is stalled - there is no way to identify abandoned reviews
An interesting possibility for future work is to create some kind of web page, which shows Active, Ongoing and Stalled reviews and allows reviewers and contributors to monitor what is going on and what is reviewed. That should help with coordination of reviews, prioritising review capacity, etc.
Something similar for Completed reviews may also help the Release Manager by helping identify which series (rather than patches) went into a release.
== 6 Analysis ==
Diagrams such as [66] follow the same pattern than outlined in "Log Scale diagrams" above.
[66]: because 2015 is not yet completed the 2015 figures are incorrect (we only count the starting point of a completed review to a year; and many reviews will not yet be complete)
[67], [68]: To account for this we could in semesters (or half-years). Given that the data set has been taken yesterday, most H1 reviews should be in already
- [67] maps the starting point of a completed review to a semester
- [68] maps the end points of a completed review to a semester
What is interesting is that the 50% mark in [67] and [68] are constant, but that the 75% mark is high in [67] with a wide variation for 2014. In H1 2015, we seem to be back to normal, which is *good* news. This is consistent with some of the other data and leads us to believe that this was caused by an influx of a lot of unexperienced contributors.
The spikes in [68] appear to have to do with release cycle for Xen 4.3 (March) and 4.5 (Jan) and show a surge of patches being applied after master for these cycles re-opened. [69] - [79] look at the same data as [67] and [68] and break it down by size of series. Only sizes "1 patch" and "> 4 patches" per series are statistically significant.
If you look at the these, this is consistent with S1 (copied from above)
S1) We had a very high influx of complex patches, clogging up the review pipeline. However the situation seems to be have become better in the first half of 2015.
[80] - [81] looks at the distribution of patches by size and how it evolved. Again this is consistent with S1
== Possible Future work == Any concrete input in what we should be focussing on would be welcome
F1) Zooming in on some areas where the data analysis is not yet sufficient (e.g. list and recognise reviewers accurately, do more statistical analysis of some areas in sections 1-5 similar to those in section 6)
F2) Fixing some of the tooling such that it covers more reviews : in particular matching commit messages with review headlines. This is relatively crude.
F3) Automating dataset report generation, such that I can continue to monitor the situation
F4) An interesting possibility for future work is to create some kind of web page, which shows Active, Ongoing and Stalled reviews.
|