
|
[Date Prev][Date Next][Thread Prev][Thread Next][Date Index][Thread Index] Re: A KernelShark plugin for Xen traces analysis
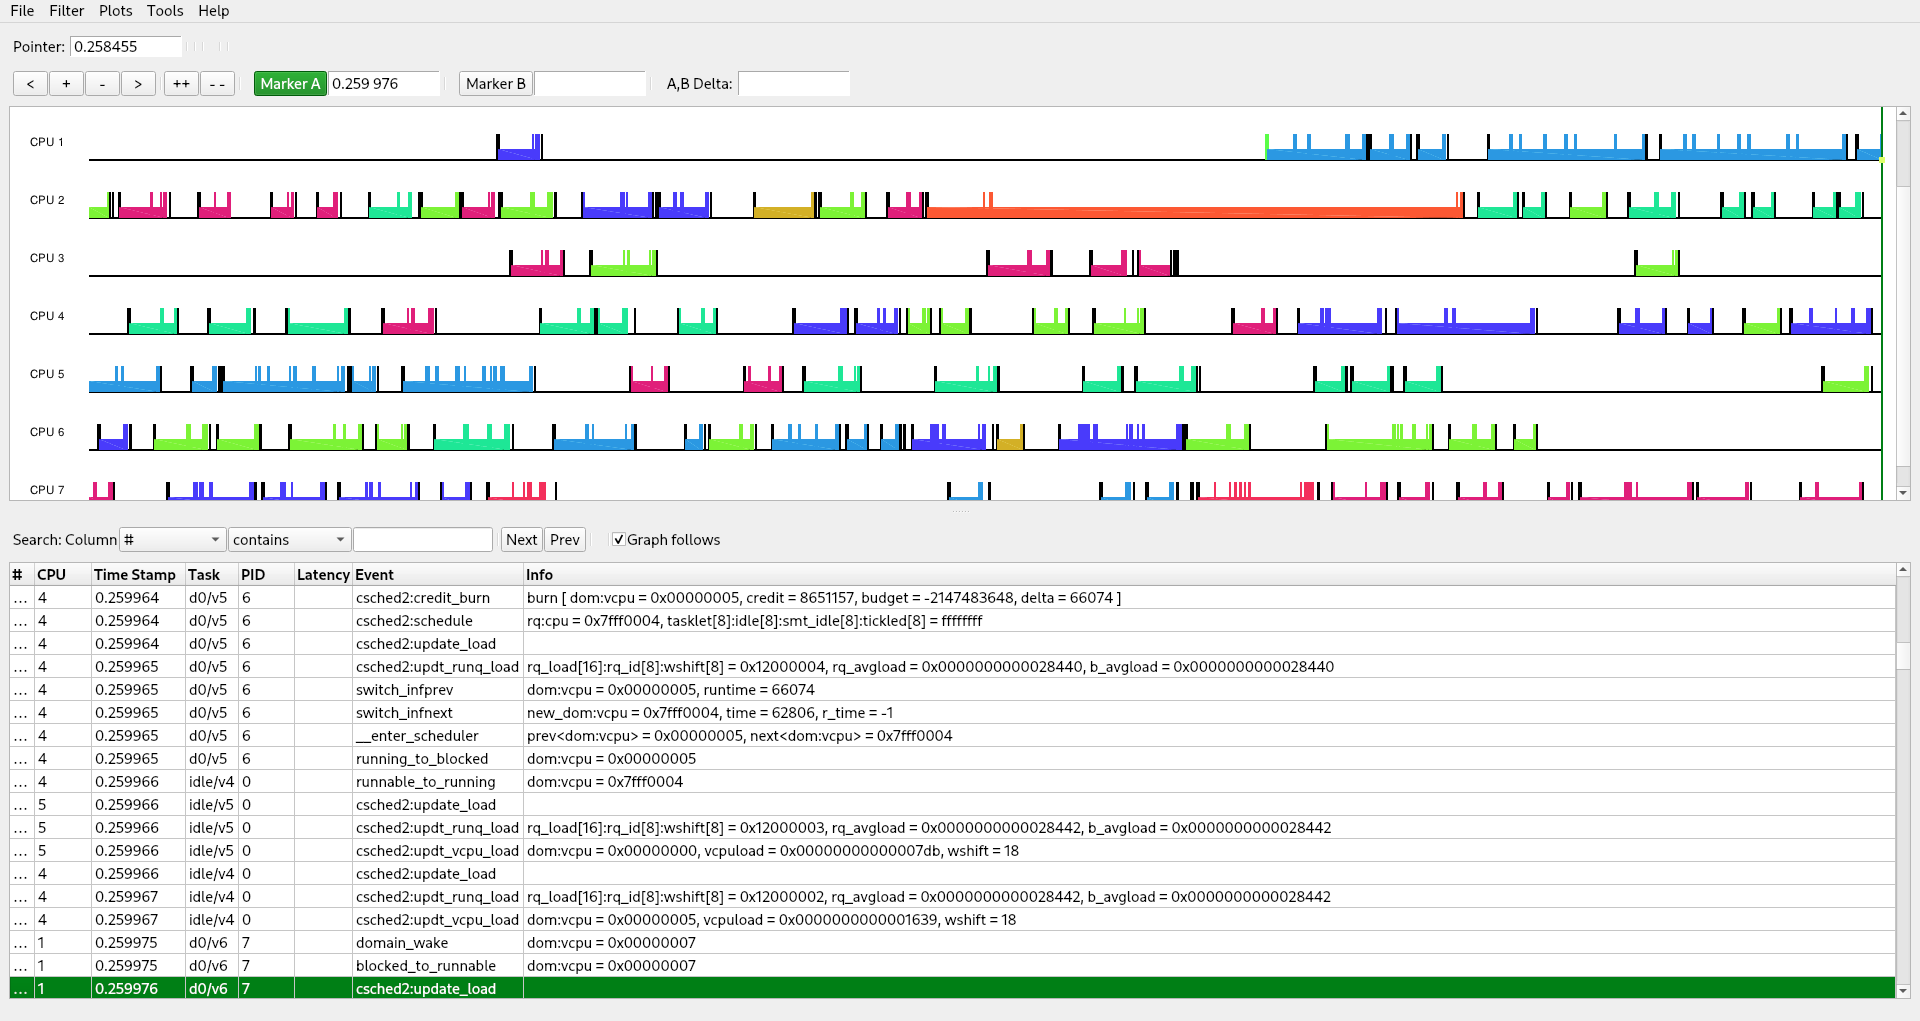
On Wed, 2021-04-14 at 11:07 +0100, Andrew Cooper wrote:
> On 13/04/2021 16:46, Steven Rostedt wrote:
> In a Xen system, dom0 is just a VM, and particularly on larger servers,
> may not be as many vcpus as the system has logical threads.
>
> This causes major problems for `perf` support under Xen, which assumes
> that the kernel's idea of CPUs matches that of the system.
>
Yeah, but we wouldn't need anything like that, in this case.

> When rendering a trace including Xen data, Xen can provide the real
> system CPUs, and dom0 wants to be rendered as a VM under Xen, similar
> to
> trace-Fedora21 in your screenshot above.  (Obviously, if you're doing
> nested virt, things need to start nesting.)
>
Exactly!

So, basically, events captured with trace-cmd on Dom0 will end up in a,
say, trace-dom0.dat file. It will contain ftrace event records, each
one with a timestamp and the ID of the CPU where it occurred. Of
course, in this case, that ID would be the ID of one of the Dom0 vCPUs
(seen from inside Dom0 itself).

And the same for all the trace files collected inside any other guest.

In KVM, vCPUs are Linux task. In fact, in Steve's screenshot [1], you
can see a task called 'CPU 0/KVM', with PID 2356. Note, however, that
with the KVM-Combo view active, there's a special 'CPU 0/KVM-2356' plot
in the graph. That shows _when_ that particular task, which is vCPU 0
of the KVM VM, runs. It's special because it has a 'CPU 0' plot "glued"
to it. In that plot we see the tasks (and the events) that were running
inside the VM, on vCPU 0.

[1] http://rostedt.org/private/kernelshark-kvm.png

So, if task A run from time t1 to time t2 on vCPU 0 of the Fedora21 KVM
guest, which in turn was running on physical CPU 3, we will see a non-
white (magenta, in the screenshot) box between t1 and t2 in the 'CPU
0/KVM-2356'. And we will see a non-white box on the 'CPU 0' plot which
is "glued" to 'CPU 0/KVM-2356' (it will be of whatever color KS decides
decide to use for task A, say, blue).

If at time t2 task B starts to run on vCPU 0 of Fedora21, and runs
until t3, we'll still see the magenta box on the 'CPU 0/KVM-2356',
between t2 and t3, while on the 'CPU 0' plot glued to it, we'll see a
box of whatever color is chosen for B (say, yellow).

Note that you don't see, from just this plots, _where_ task 2356 is
running, as in on which physical CPU. That will be visible in the CPU
plots, which do not appear in Steve's screenshot. Basically, if 2356
(i.e., the task corresponding to vCPU 0 of the Fedora21 VM) was running
on physical CPU 3 between t1 and t3, we'll see a magenta box, between
t1 and t3, on the plot called 'CPU 3 (and this is a "single plot",
i.e., one that does not have any other plot "glued" to it, e.g., like
the ones that are visible in Giuseppe's screenshot).

In the case of Xen, it's not that different. vCPUs are modeled and
considered by the plugin as if they where Linux tasks. In fact, you see
in Giuseppe's screenshot [2] that the 'Task' column contains strings
such as "d0/v5" or "idle/v4".

[2]
https://raw.githubusercontent.com/giuseppe998e/kernelshark-xentrace-plugin/master/.github/img/ks-xentrace.png

We needed to come up with a PID, as KS not only wants to print it in
the relevant column, but it uses it for associating colors to tasks
(i.e., colors to vCPUs, in our case). Currently, the value stored in
that PID field is computed as a combination of domain ID and vCPU ID.

If d0v5 runs on CPU 6 from t1 to t3, we'll see a, let's say, green box
between t1 and t3 on the CPU plot CPU 6. And this is something that
Giuseppe's plugin can already tell (show! :-D) us.

If task A runs on vCPU 5 of Dom0 from t1 to t2 and that task B runs
there from t2 to t3 there will be events about that in our
trace-dom0.dat file (collected via trace-cmd), and the CPU-ID of these
events will be 5.

A "Xen-Combo" plugin will have to have a way to know that events from
the trace-dom0.dat file which have a CPU-IDs equal to 5 should be
matched with task 'd0/v5' from the trace.xen file (collected via
xentrace).

It will therefore draw, in addition to the CPU plots that are already
there in the current version of the plugin (what plots one wants to
visualize is configurable, BTW) some special plots, one for each vCPU
running on the system, including the ones of dom0 (or, at least, one
for each vCPUs of each domain for which we have a trace file).

Among these special plots, there will be a 'd0/v5' plot which will have
a green box between t1 and t3. And "glued" on top of it, there will be
a 'CPU 5' plot which will have, say, a blue box between t1 and t2 and a
yellow box between t2 and t3.

As for the KVM case, the CPU plots will tell you on what physical CPU
d0v5 runs. While the special 'CPU 5' plot that is "glued" to the
'd0/v5' one will tell you what tasks run on vCPU 5 of Dom0, at any
given point in time.

Regards
--
Dario Faggioli, Ph.D
http://about.me/dario.faggioli
Virtualization Software Engineer
SUSE Labs, SUSE https://www.suse.com/
-------------------------------------------------------------------
<<This happens because _I_ choose it to happen!>> (Raistlin Majere)
Attachment:
signature.asc
|
 |
Lists.xenproject.org is hosted with RackSpace, monitoring our |