
|
[Date Prev][Date Next][Thread Prev][Thread Next][Date Index][Thread Index] Re: Issue: Networking performance in Xen VM on Arm64
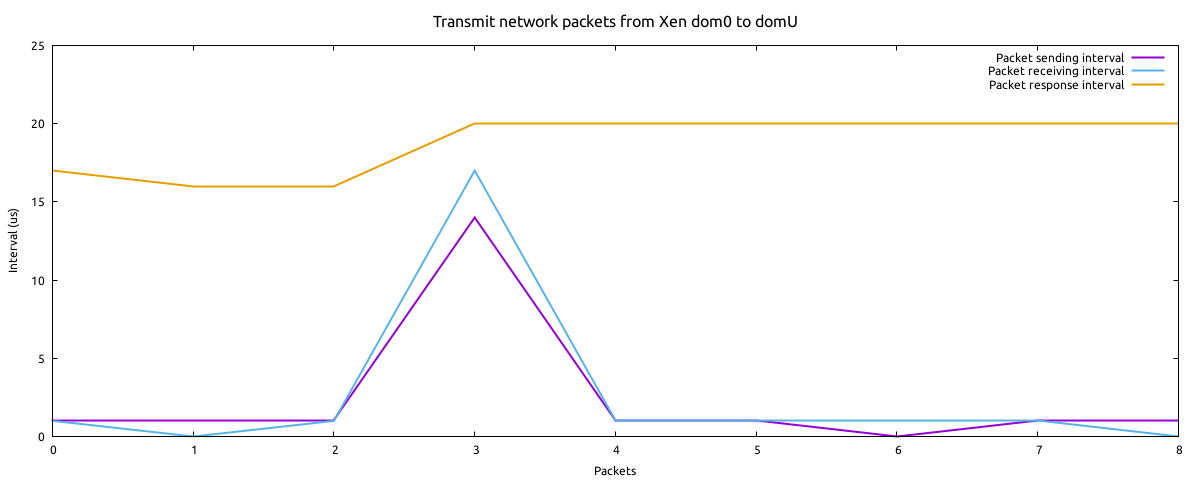
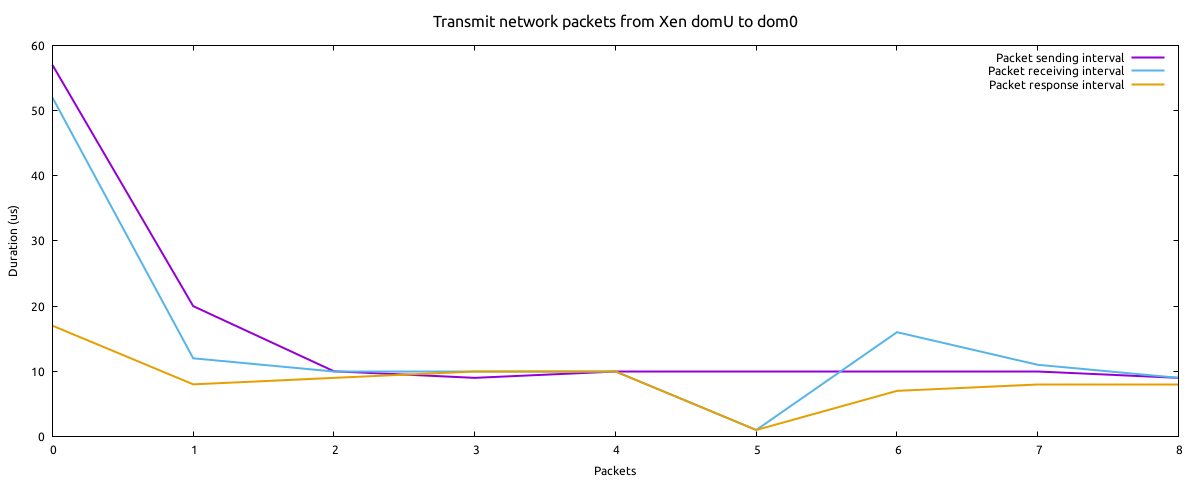
Hi Stefano,

On Tue, Oct 25, 2022 at 04:58:16PM -0700, Stefano Stabellini wrote:
> On Mon, 24 Oct 2022, Leo Yan wrote:
> > > If you are really running with the NULL scheduler, then I would
> > > investigate why the vCPU has is_running == 0 because it should not
> > > happen.
> >
> > Correct for this: it's my bad that I didn't really enable NULL scheduler
> > in my code base.  After I enabled NULL scheduler, the latency by context
> > switching is dismissed.
> >
> >  8963              pub-338   [002]   217.777652: bprint:
> > xennet_tx_setup_grant: id=60 ref=1340 offset=2 len=1514 TSC: 7892178799
> >  8964              pub-338   [002]   217.777662: bprint:
> > xennet_tx_setup_grant: id=82 ref=1362 offset=2050 len=1006 TSC: 7892179043
> >  8965     ksoftirqd/12-75    [012]   255.466914: bprint:
> > xenvif_tx_build_gops.constprop.0: id=60 ref=1340 offset=2 len=1514 TSC:
> > 7892179731
> >  8966     ksoftirqd/12-75    [012]   255.466915: bprint:
> > xenvif_tx_build_gops.constprop.0: id=82 ref=1362 offset=2050 len=1006 TSC:
> > 7892179761
> >  8967              pub-338   [002]   217.778057: bprint:
> > xennet_tx_setup_grant: id=60 ref=1340 offset=2050 len=1514 TSC: 7892188930
> >  8968              pub-338   [002]   217.778072: bprint:
> > xennet_tx_setup_grant: id=53 ref=1333 offset=2 len=1514 TSC: 7892189293
> >  8969       containerd-2965  [012]   255.467304: bprint:
> > xenvif_tx_build_gops.constprop.0: id=60 ref=1340 offset=2050 len=1514 TSC:
> > 7892189479
> >  8970       containerd-2965  [012]   255.467306: bprint:
> > xenvif_tx_build_gops.constprop.0: id=53 ref=1333 offset=2 len=1514 TSC:
> > 7892189533
>
> I am having difficulty following the messages. Are the two points [a]
> and [b] as described in the previous email shown here?

No, the [b] point is about the trace point in Xen hypvervisor.

For easier review I combined the trace log from Xen dom0 and dom0
Linux kernels, in above log, the function xennet_tx_setup_grant() is
traced from domU Linux kernel and the function
xenvif_tx_build_gops.constprop.0 from dom0 Linux kernel and I sorted
the logs with TSC (Arm arch timer physical counter).

Sorry for confusion and I didn't explain clearly.

> > So the xennet (Xen net forend driver) and xenvif (net backend driver)
> > work in parallel.  Please note, I didn't see networking performance
> > improvement after changed to use NULL scheduler.
> >
> > Now I will compare the duration for two directions, one direction is
> > sending data from xennet to xenvif, and another is the reversed
> > direction.  It's very likely the two directions have significant
> > difference for sending data with grant tables, you could see in above
> > log, it takes 20~30us to transmit a data block (we can use the id
> > number and grant table's ref number to match the data block in xennet
> > driver and xenvif driver).
> >
> > > Now regarding the results, I can see the timestamp 3842008681 for
> > > xennet_notify_tx_irq, 3842008885 for vgic_inject_irq, and 3842008935 for
> > > vcpu_kick. Where is the corresponding TSC for the domain receiving the
> > > notification?
> > >
> > > Also for the other case, starting at 3842016505, can you please
> > > highlight the timestamp for vgic_inject_irq, vcpu_kick, and also the one
> > > for the domain receiving the notification?
> > >
> > > The most interesting timestamps would be the timestamp for vcpu_kick in
> > > "notification sending domain" [a], the timestamp for receiving the
> > > interrupt in the Xen on pCPU for the "notification receiving domain"
> > > [b], and the timestamp for the "notification receiving domain" getting
> > > the notification [c].
> > >
> > > If really context switch is the issue, then the interesting latency
> > > would be between [a] and [b].
> >
> > Understand.  I agree that I didn't move into more details, the main
> > reason is Xen dmesg buffer is fragile after adding more logs, e.g.
> > after I added log in the function gicv3_send_sgi(), Xen will stuck
> > during the booting phase, and after adding logs in
> > leave_hypervisor_to_guest() it will introduce huge logs (so I need to
> > only trace for first 16 CPUs to mitigate log flood).
> >
> > I think it would be better to enable xentrace for my profiling at my
> > side.  If I have any further data, will share back.
>
> Looking forward to it. Without more details it is impossible to identify
> the source of the problem and fix it.

The application passes data to Linux kernel and low level driver needs
to transfer skbs between Xen network frontend and backend drivers via
Xen shared ring buffer / grant table.  So let's step back to review
the duration in the network drivers for sending and receiving skbs.

I measured intervals for sending skbs, one direction is for sending skb
from dom0 to domU and another direction is from domU to dom0. For easier
review, I plotted the intervals in diagrams [1][2] for these two
directions respectively.

In a diagram it has three metrics:

- Packet sending interval: measures the interval from the sender.

  For the direction from dom0 to domu, this metric measures the
  interval for sending skbs in the Xen backend driver in dom0.

  For the direction from domU to dom0, this metric measures the
  interval for sending skbs in the Xen frontend driver in domU.

- Packet receiving interval: measures the interval for the receiver.

  For the direction from dom0 to domu, this metric measures the
  interval for receiving skbs in the Xen frontend driver in domU.

  For the direction from domU to dom0, this metric measures the
  interval for receiving skbs in the Xen backend driver in dom0.

- Packet response interval: measures the interval between sender and
  receiver.

  This interval measures the duration between a skb is sending out
  from the sender and until it's fetched from grant table by the
  receiver.

>From these three metrics we can know the latency is caused by three
actors: sender, receiver, Xen hypervisor.

In two diagrams we can see the packet response interval (yellow line)
is about 10~20us.  The response interval for domu -> dom0 (~10us) is
even better than the interval for dom0 -> domu (15~20us), which means
the response time is not the curplit for the poor performance when
sending data from domu to dom0.

The purple line and blue line for sending and receiving intervals are
correlated, this means the drivers in two sides (dom0 and domU) work in
parallel.

A big difference is we can see the sending interval (purple line) in the
diagram xmit_interval_dom0_to_domu.png usually keeps at ~1us, but the
sending interval in the diagram xmit_interval_domu_to_dom0.png is
about 10us.

If map to the code, I think the function xennet_start_xmit() in Xen
frontend driver is critical for the sending interval in domU.  I can
see several things cost time when sending a packet:

- Xen frontend driver needs to setup grant table for every skb, it
  invokes the function xennet_tx_setup_grant() and
  gnttab_grant_foreign_access_ref() to prepare grant table;

- Xen frontend driver sends notification by calling
  notify_remote_via_irq().  It will trap to Xen hypervisor to send the
  interrupt, this takes several macro seonds for this step.

- Xen frontend driver calls xennet_tx_buf_gc(), the interval for this
  function is vary, it will take ~30us in the case for reclaiming grant
  table.

Any thoughts for this?

Thanks,
Leo

[1] https://people.linaro.org/~leo.yan/xen/xmit_interval_dom0_to_domu.png
[2] https://people.linaro.org/~leo.yan/xen/xmit_interval_domu_to_dom0.png

P.s. I will take other priority tasks from next week, it's pity that I
cannot fix the issue at this point.  Just want you know I will take this
task as low priority, but if you have any idea I can give a try or
test at my side.
|
 |
Lists.xenproject.org is hosted with RackSpace, monitoring our |