
|
[Date Prev][Date Next][Thread Prev][Thread Next][Date Index][Thread Index] [Xen-devel] schedulers and topology exposing questions
Hello all!
Dario, Gerorge or anyone else, your help will be appreciated.
Let me put some intro to our findings. I may forget something or put something
not too explicit, please ask me.
Customer filled a bug where some of the applications were running slow in their
HVM DomU setups.
These running times were compared against baremetal running same kernel version
as HVM DomU.
After some investigation by different parties, the test case scenario was found
where the problem was easily seen. The test app is a udp server/client pair
where
client passes some message n number of times.
The test case was executed on baremetal and Xen DomU with kernel version 2.6.39.
Bare metal showed 2x times better result that DomU.
Konrad came up with a workaround that was setting the flag for domain scheduler
in linux
As the guest is not aware of SMT-related topology, it has a flat topology
initialized.
Kernel has domain scheduler flags for scheduling domain CPU set to 4143 for
2.6.39.
Konrad discovered that changing the flag for CPU sched domain to 4655
works as a workaround and makes Linux think that the topology has SMT threads.
This workaround makes the test to complete almost in same time as on baremetal
(or insignificantly worse).
This workaround is not suitable for kernels of higher versions as we discovered.
The hackish way of making domU linux think that it has SMT threads (along with
matching cpuid)
made us thinks that the problem comes from the fact that cpu topology is not
exposed to
guest and Linux scheduler cannot make intelligent decision on scheduling.
Joao Martins from Oracle developed set of patches that fixed the smt/core/cashe
topology numbering and provided matching pinning of vcpus and enabling options,
allows to expose to guest correct topology.
I guess Joao will be posting it at some point.
With this patches we decided to test the performance impact on different kernel
versionand Xen versions.
The test described above was labeled as IO-bound test.
We have run io-bound test with and without smt-patches. The improvement
comparing
to base case (no smt patches, flat topology) shows 22-23% gain.
While we have seen improvement with io-bound tests, the same did not happen
with cpu-bound workload.
As cpu-bound test we use kernel module which runs requested number of kernel
threads
and each thread compresses and decompresses some data.
Here is the setup for tests:
Intel Xeon E5 2600
8 cores, 25MB Cashe, 2 sockets, 2 threads per core.
Xen 4.4.3, default timeslice and ratelimit
Kernels: 2.6.39, 4.1.0, 4.3.0-rc7+.
Dom0: kernel 4.1.0, 2 vcpus, not pinned.
DomU has 8 vcpus (except some cases).
For io-bound tests results were better with smt patches applied for every
kernel.
For cpu-bound test the results were different depending on wether vcpus were
pinned or not, how many vcpus were assigned to the guest.
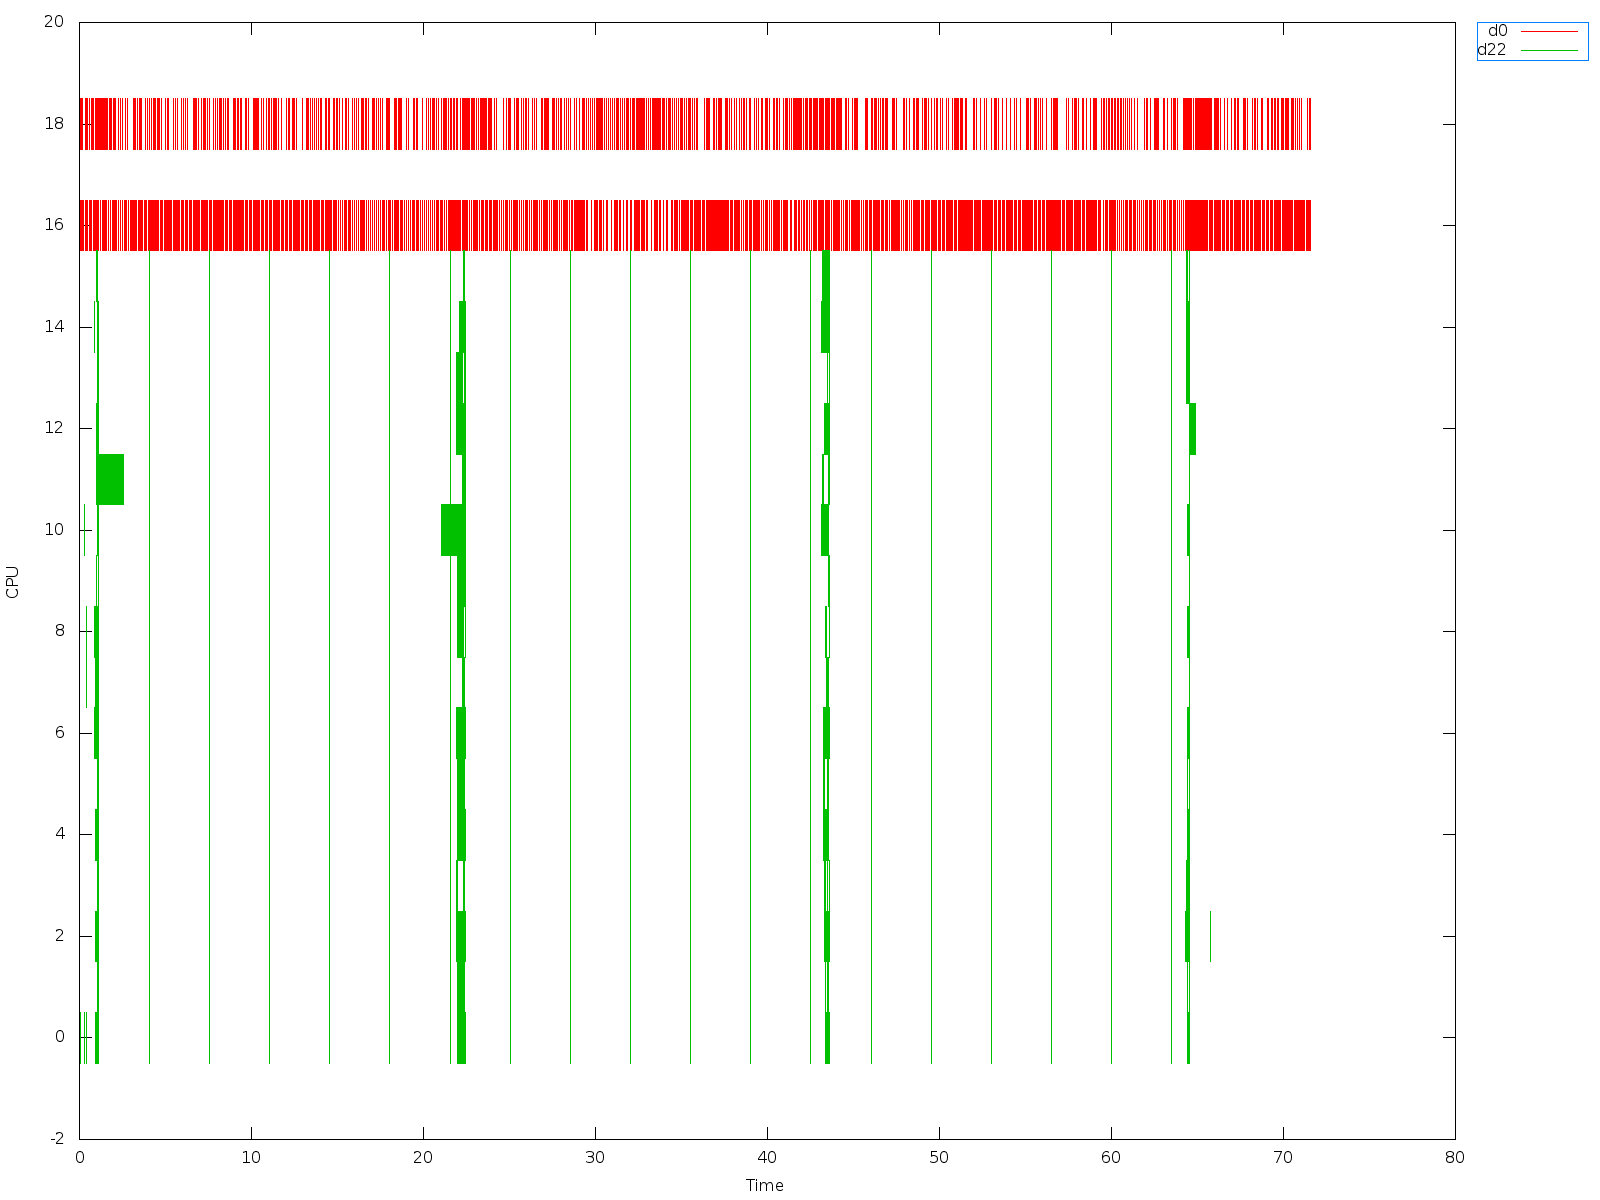
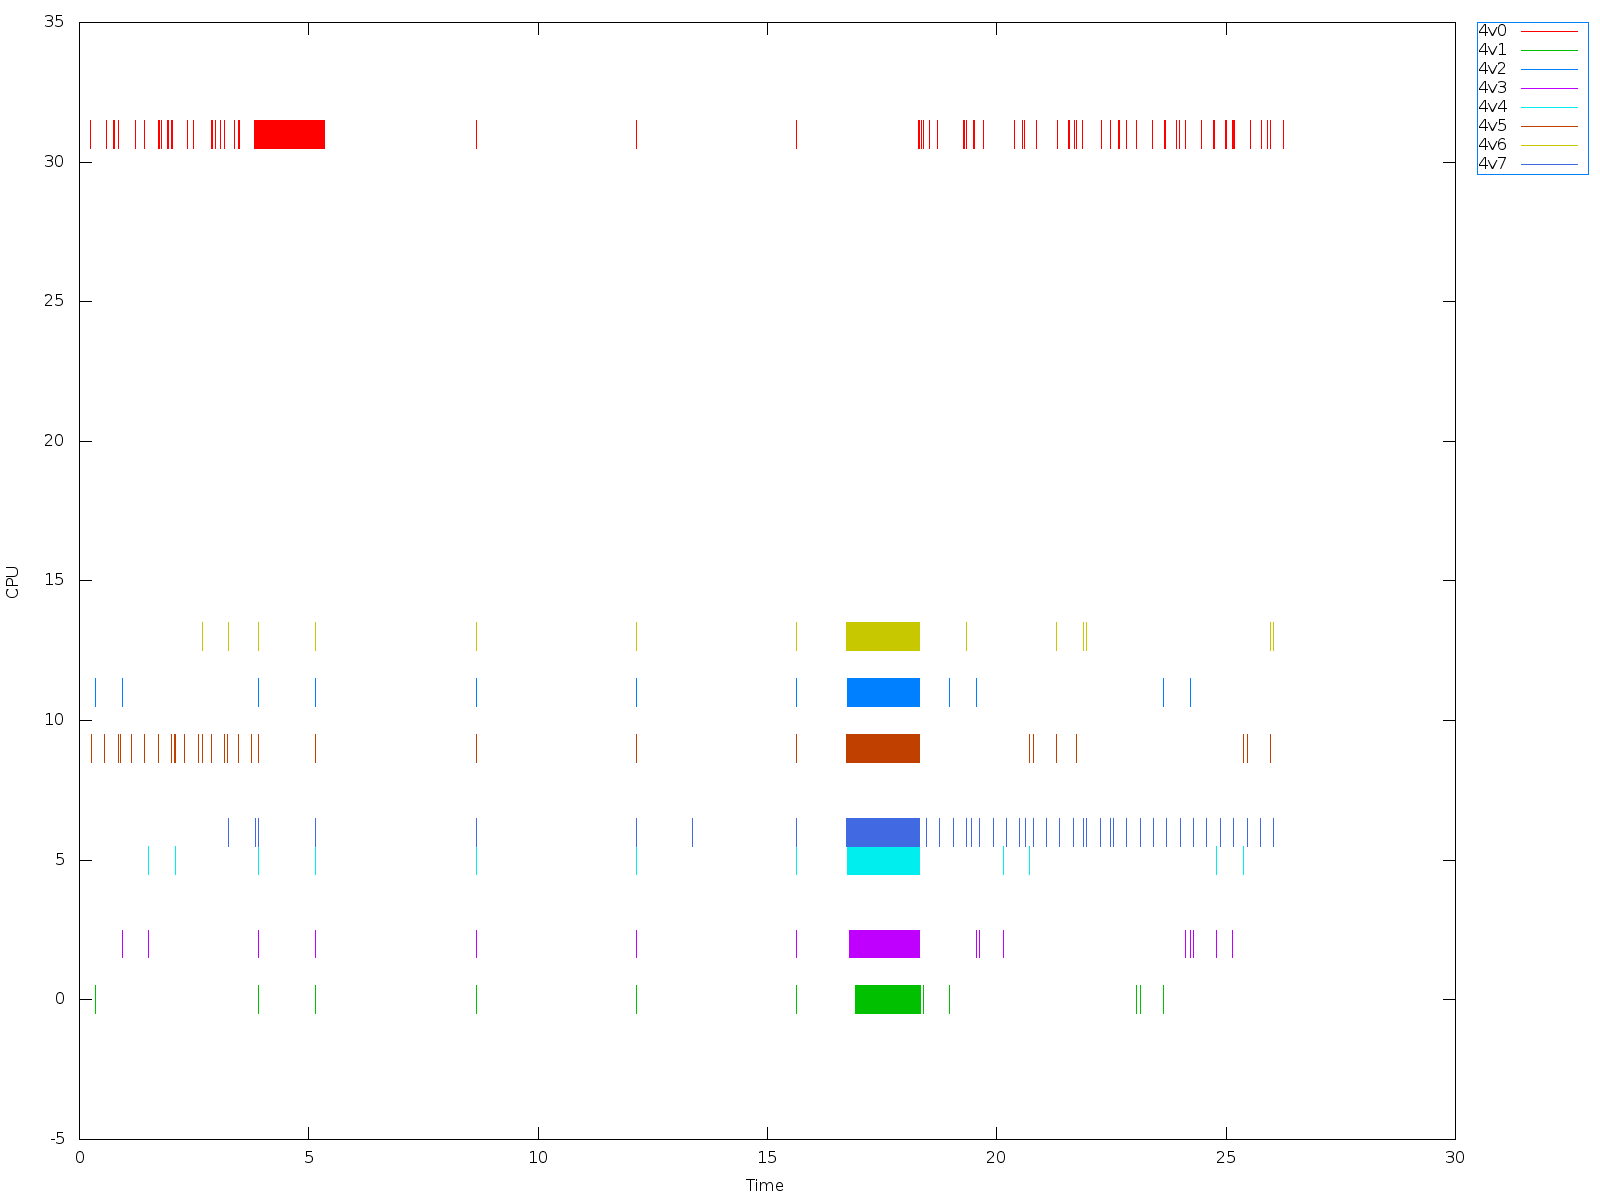
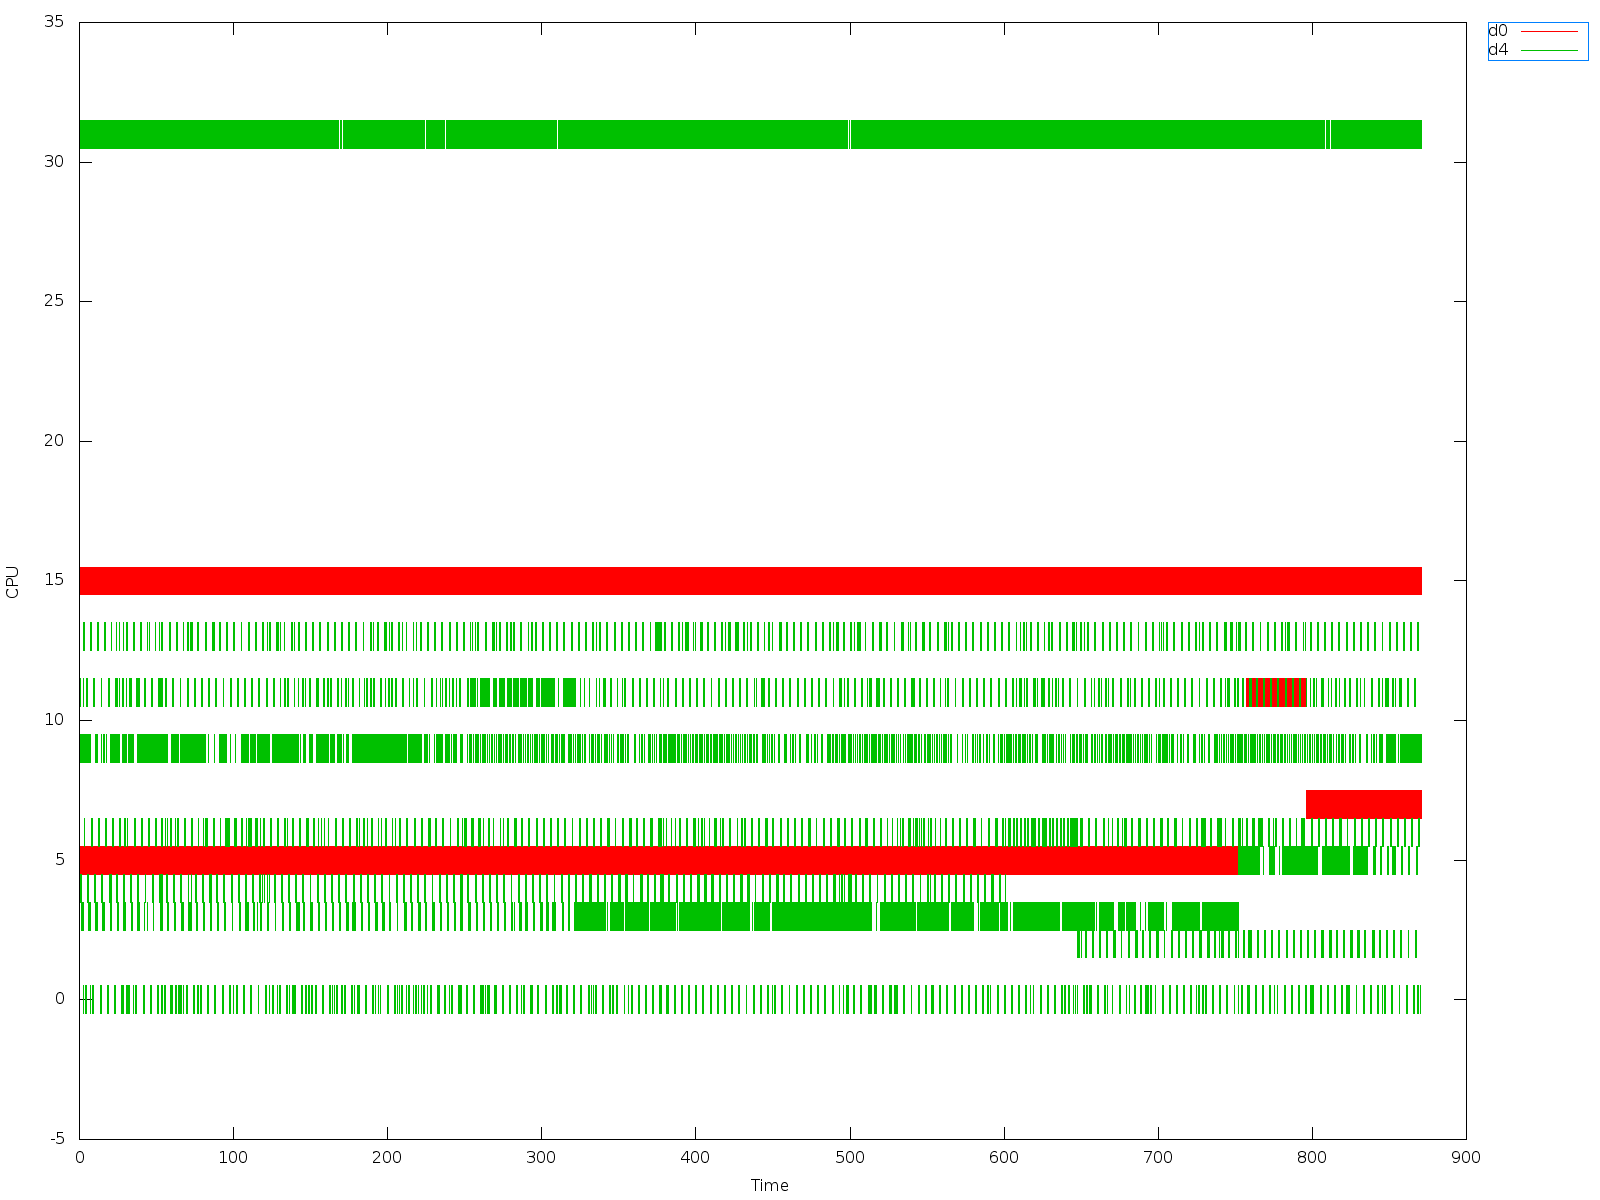
Please take a look at the graph captured by xentrace -e 0x0002f000
On the graphs X is time in seconds since xentrace start, Y is the pcpu number,
the graph itself represent the event when scheduler places vcpu to pcpu.
The graphs #1 & #2:
trace_iobound_nosmt_dom0notpinned.out.plot.err.png - io bound test, one
client/server
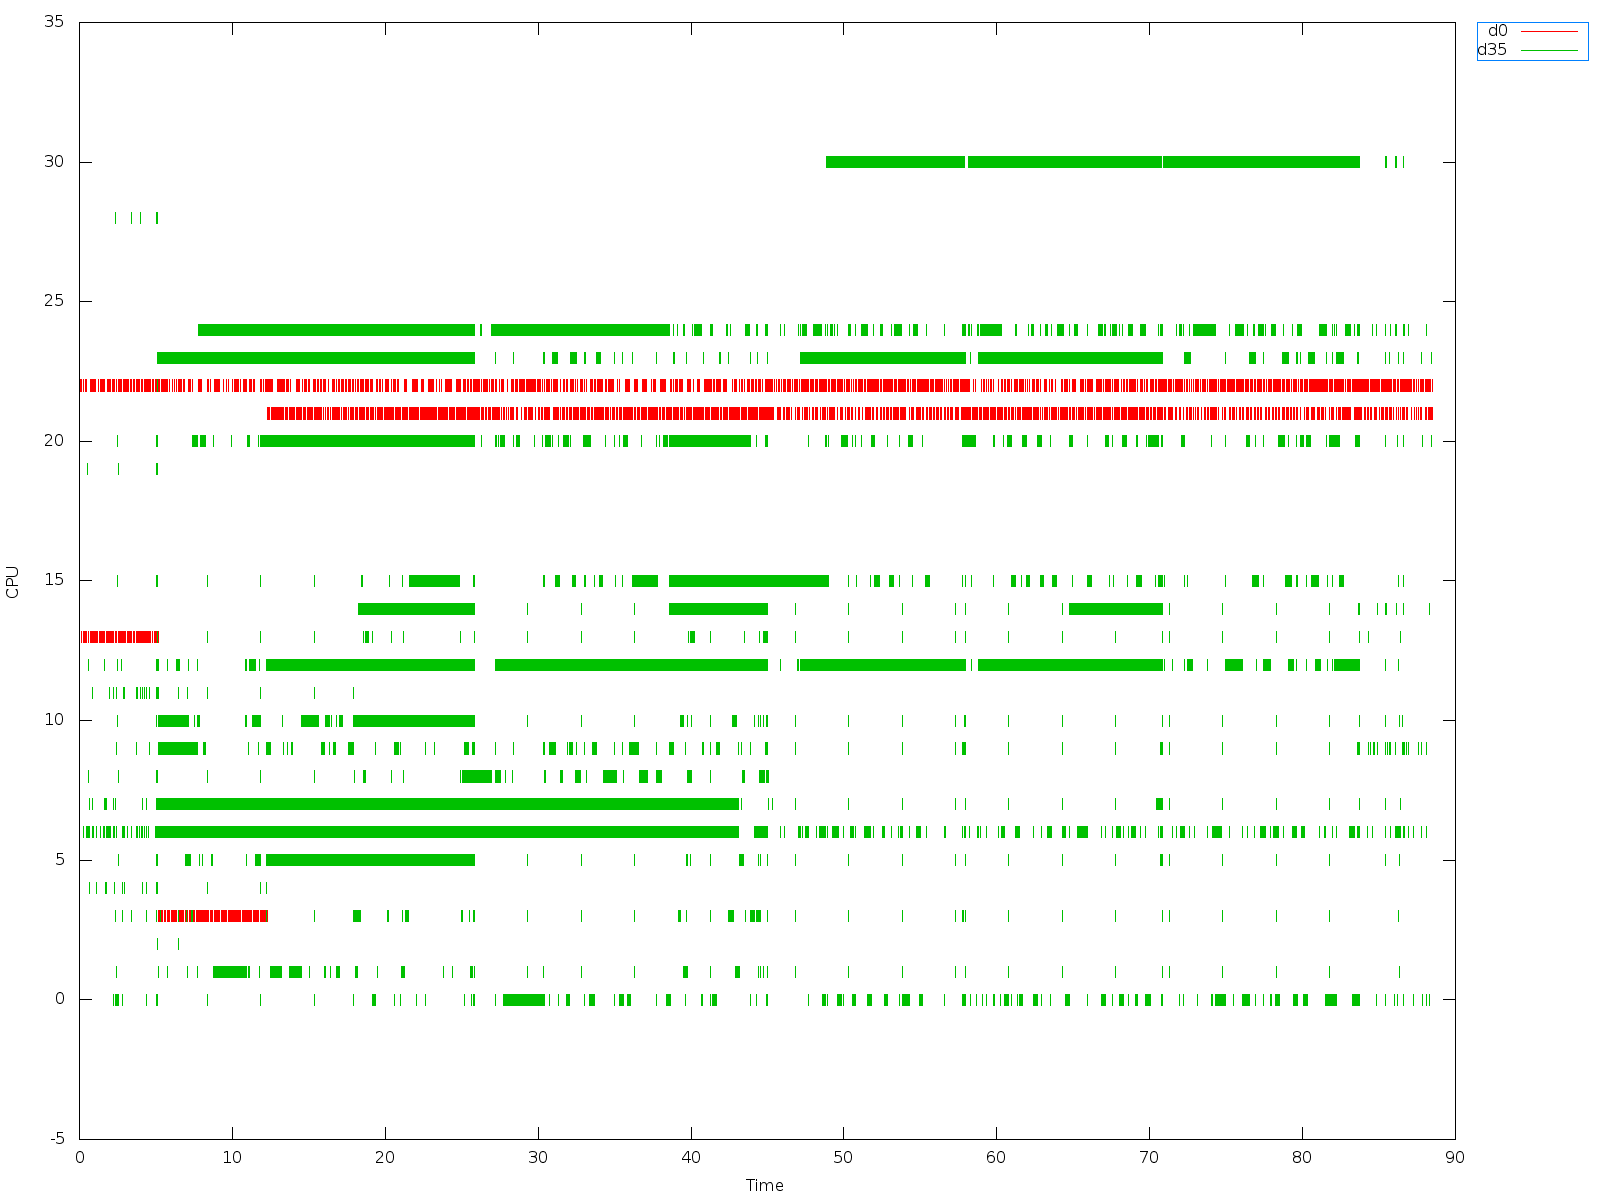
trace_cpuboud_nosmt_dom0notpinned.out.plot.err.png - cpu bound test, 8 kernel
theads
config: domu, 8vcpus not pinned, smt patches not applied, 2.3.69 kernel.
As can be seen here scheduler places the vcpus correctly on empty cores.
As seen on both, vcpu0 gets scheduled on pcpu 31. Why is this?
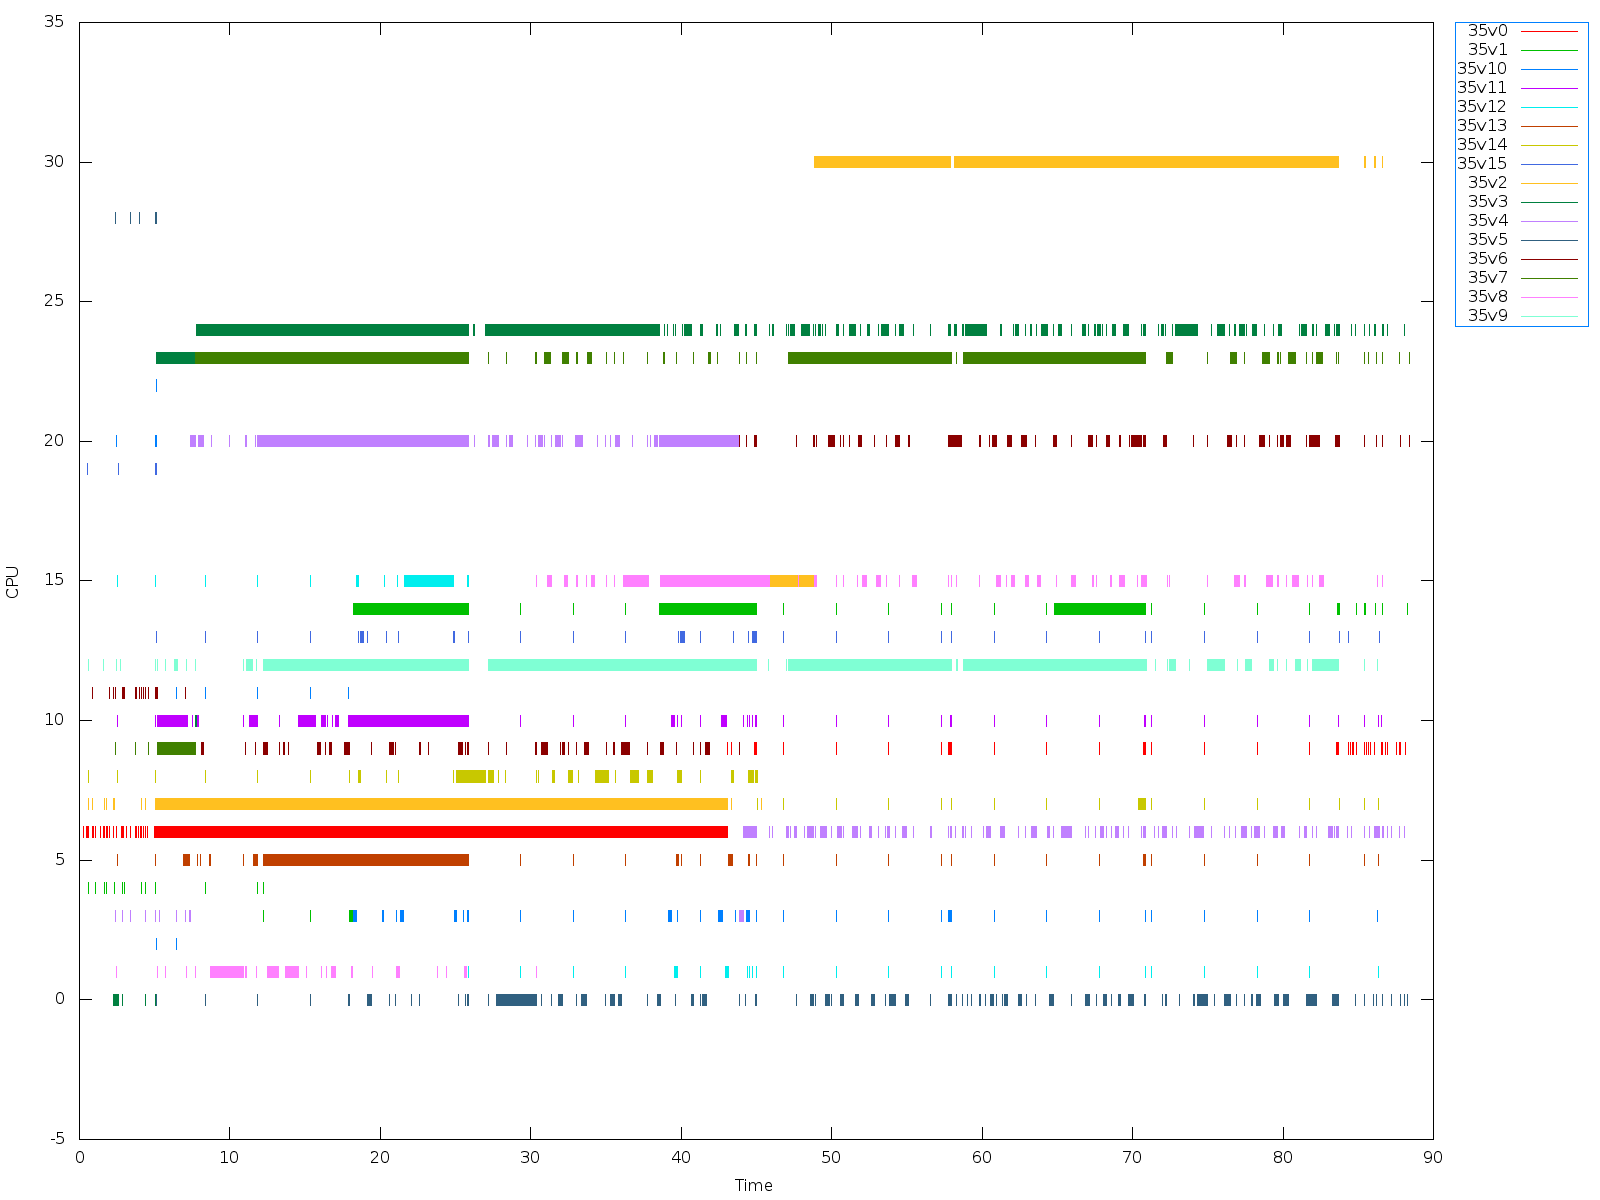
Take a look at trace_cpuboud_nosmt_dom0notpinned.out.plot.err_pervcpu.nodom0.png
where I split data per vcpus.
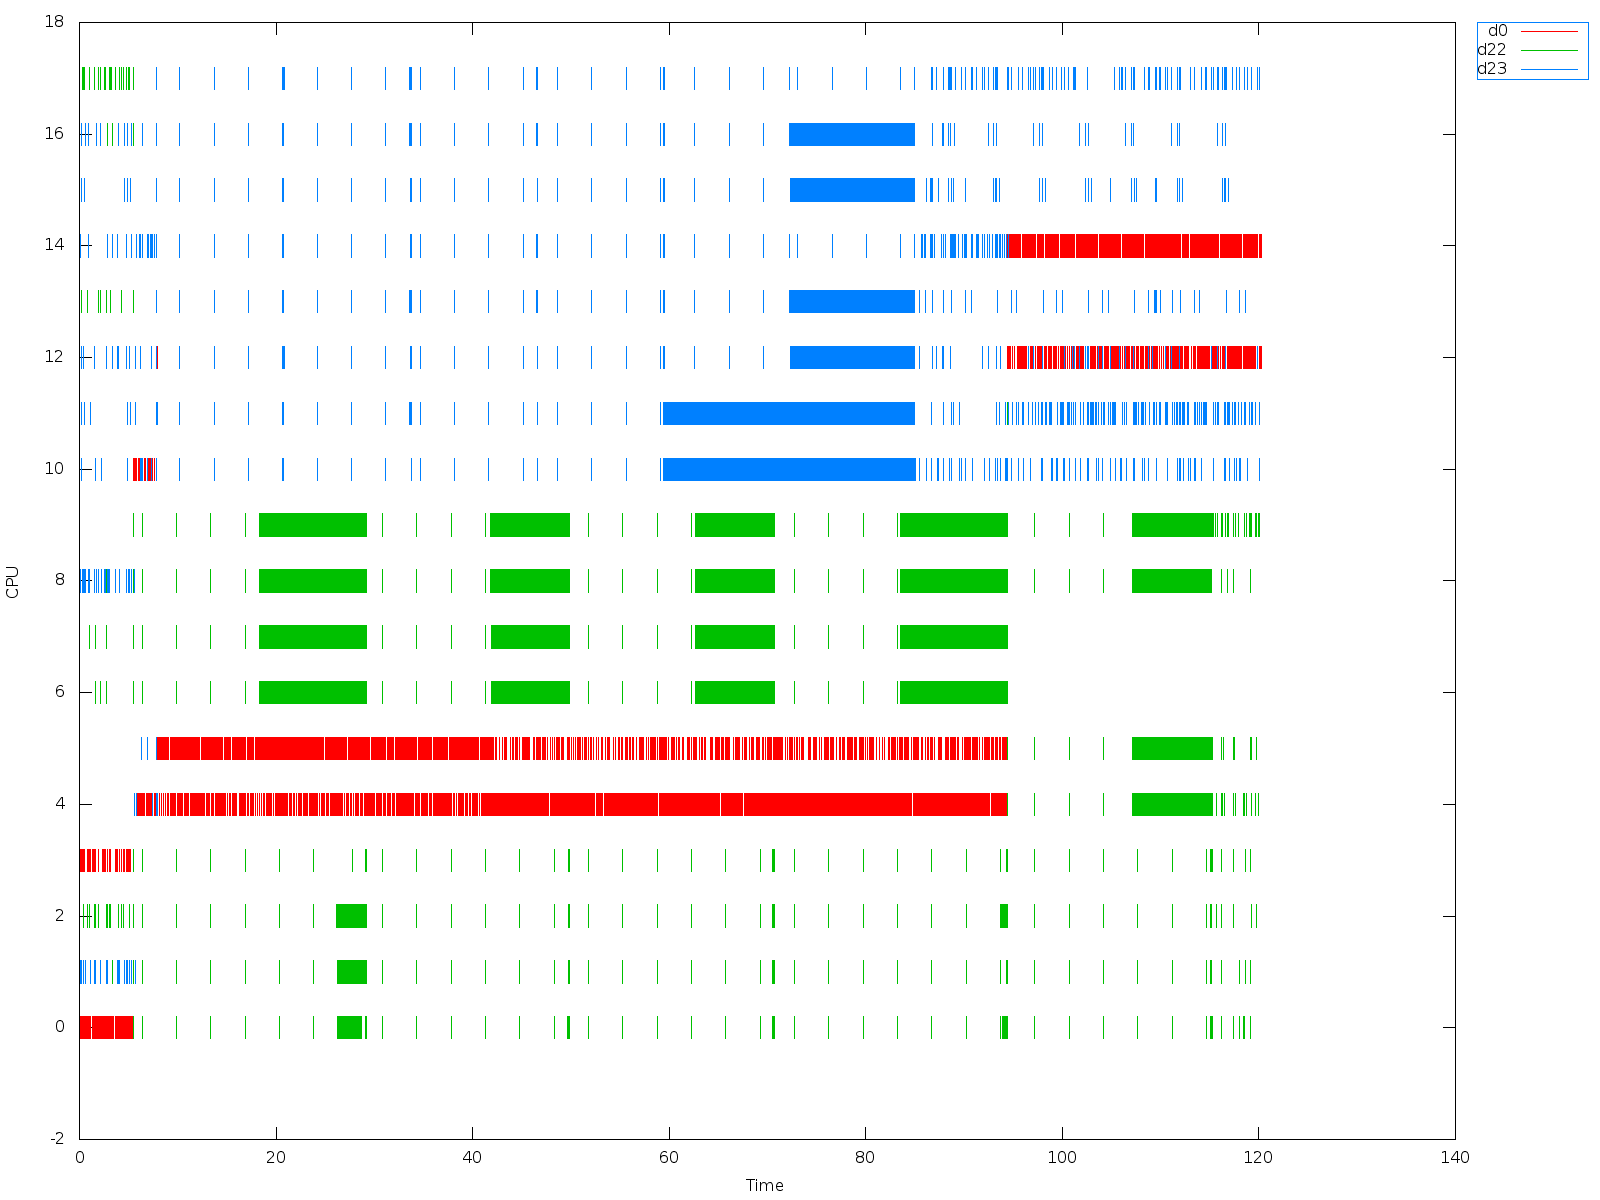
Now to cpu-bound tests.
When smt patches applied and vcpus pinned correctly to match the topology and
guest become aware of the topology, cpu-bound tests did not show improvement
with kernel 2.6.39.
With upstream kernel we see some improvements. The tes was repeated 5 times
back to back.
The number of vcpus was increased to 16 to match the test case where linux was
not
aware of the topology and assumed all cpus as cores.
On some iterations one can see that vcpus are being scheduled as expected.
For some runs the vcpus are placed on came core (core/thread) (see
trace_cpu_16vcpus_8threads_5runs.out.plot.err.png).
It doubles the time it takes for test to complete (first three runs show close
to baremetal execution time).
END: cycles: 31209326708 (29 seconds)
END: cycles: 30928835308 (28 seconds)
END: cycles: 31191626508 (29 seconds)
END: cycles: 50117313540 (46 seconds)
END: cycles: 49944848614 (46 seconds)
Since the vcpus are pinned, then my guess is that Linux scheduler makes wrong
decisions?
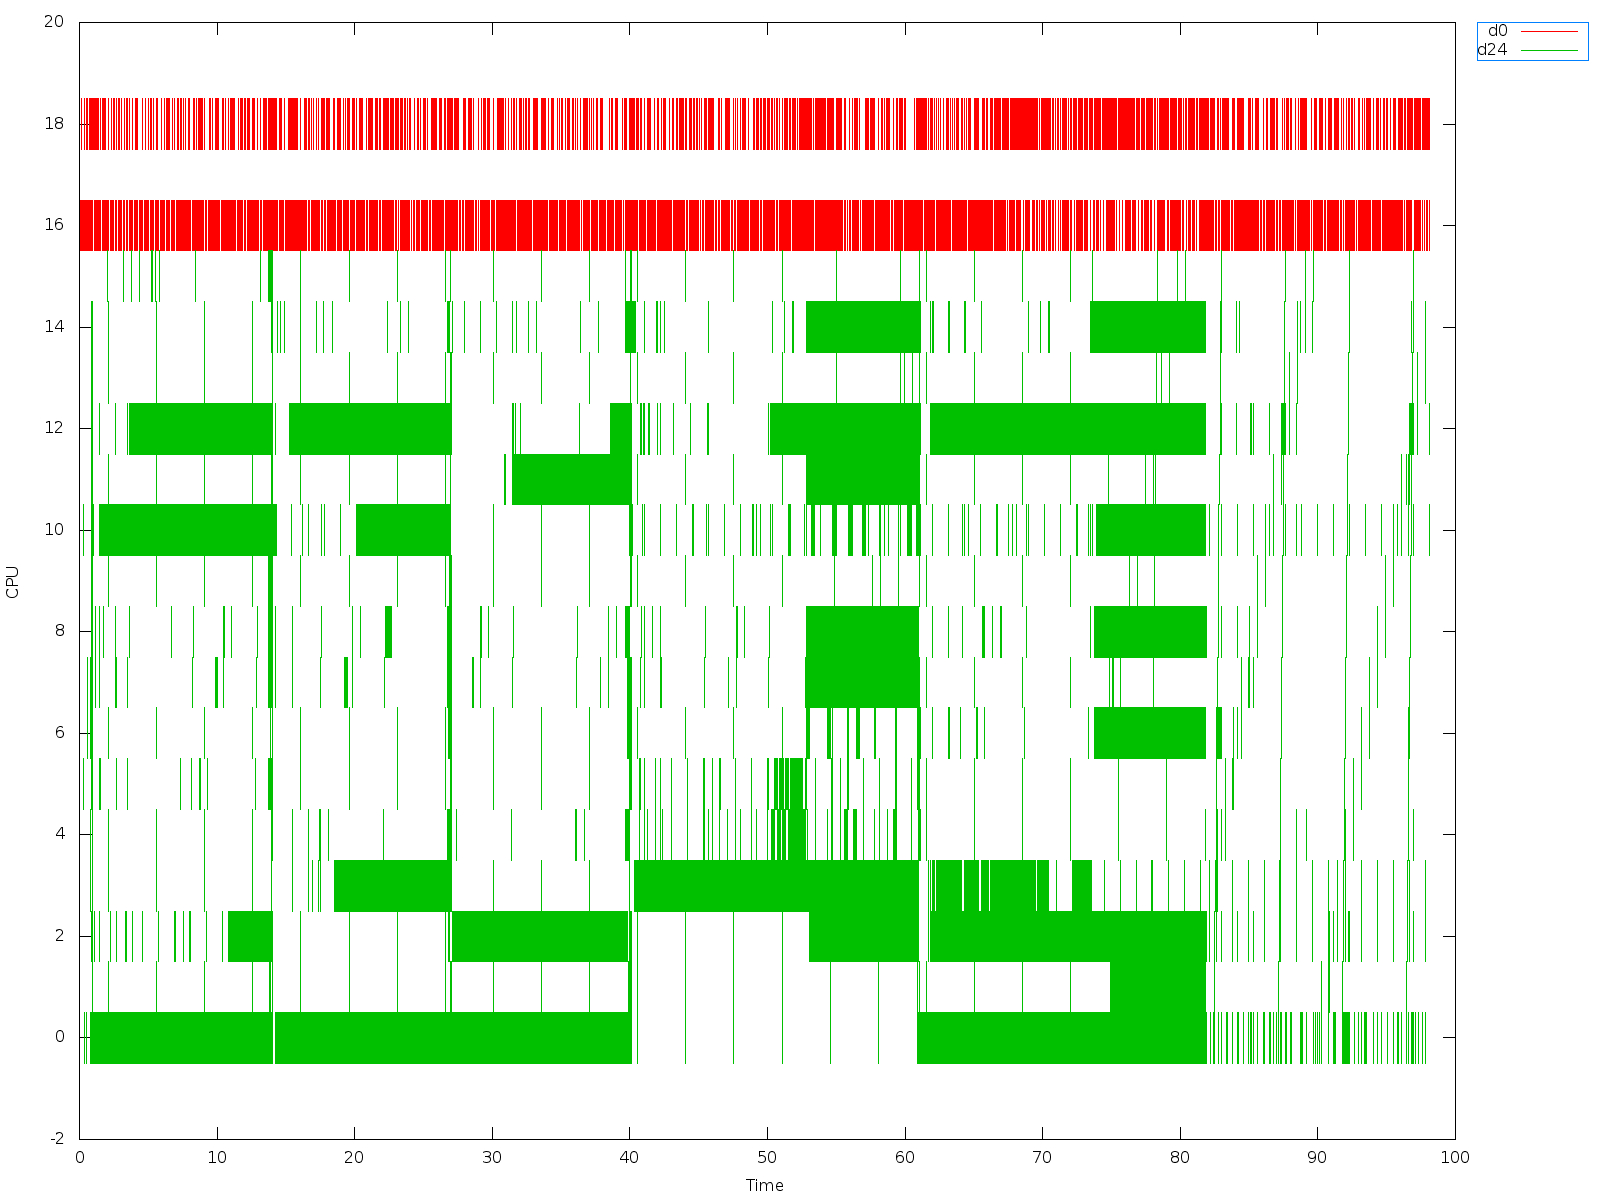
So I ran the test with smt patches enabled, but not pinned vcpus.
result is also shows the same as above (see
trace_cpu_16vcpus_8threads_5runs_notpinned_smt1_ups.out.plot.err.png):
Also see the per-cpu graph
(trace_cpu_16vcpus_8threads_5runs_notpinned_smt1_ups.out.plot.err_pervcpu.png).
END: cycles: 49740185572 (46 seconds)
END: cycles: 45862289546 (42 seconds)
END: cycles: 30976368378 (28 seconds)
END: cycles: 30886882143 (28 seconds)
END: cycles: 30806304256 (28 seconds)
I cut the timeslice where its seen that vcpu0 and vcpu2 run on same core while
other cores are idle:
35v2 9.881103815 7
35v0 9.881104013 6
35v2 9.892746452 7
35v0 9.892746546 6 -> vcpu0 gets scheduled right after vcpu2 on same core
35v0 9.904388175 6
35v2 9.904388205 7 -> same here
35v2 9.916029791 7
35v0 9.916029992 6
Disabling smt option in linux config (what essentially means that guest does not
have correct topology and its just flat shows slightly better results - there
are no cores and threads being scheduled in pair while other cores are empty.
END: cycles: 41823591845 (38 seconds)
END: cycles: 41105093568 (38 seconds)
END: cycles: 30987224290 (28 seconds)
END: cycles: 31138979573 (29 seconds)
END: cycles: 31002228982 (28 seconds)
and graph is attached
(trace_cpu_16vcpus_8threads_5runs_notpinned_smt0_ups.out.plot.err.png).
I may have forgotten something here.. Please ask me questions if I did.
Maybe you have some ideas what can be done here?
We try to make guests topology aware but looks like for cpu bound workloads its
not that easy.
Any suggestions are welcome.
Thanks you.
Elena
--
Elena
Attachment:
trace_cpu_16vcpus_16threads_5runs.out.plot.err.png Attachment:
trace_cpu_16vcpus_8threads_5runs_notpinned_smt0_ups.out.plot.err.png Attachment:
trace_cpu_16vcpus_8threads_5runs_notpinned_smt1_ups.out.plot.err_pervcpu.png Attachment:
trace_cpu_16vcpus_8threads_5runs_notpinned_smt1_ups.out.plot.err.png Attachment:
trace_cpu_16vcpus_8threads_5runs.out.plot.err.png Attachment:
trace_cpuboud_nosmt_dom0notpinned.out.plot.err_pervcpu.nodom0.png Attachment:
trace_cpuboud_nosmt_dom0notpinned.out.plot.err.png Attachment:
trace_iobound_nosmt_dom0notpinned.out.plot.err.png Attachment:
trace_cpu_smtapplied_smt0_totalcpus18_notpinned_5iters.out.plot.err.png _______________________________________________ Xen-devel mailing list Xen-devel@xxxxxxxxxxxxx http://lists.xen.org/xen-devel
|
 |
Lists.xenproject.org is hosted with RackSpace, monitoring our |